KNOWLEDGE AND THE KNOWER—
WHAT COUNTS AS KNOWLEDGE?
THE MAP IS NOT THE TERRITORY
Magritte, René (1929) La Trahison des images (Ceci n’est pas une pipe) The Treachery of Images (This is not a pipe) Oil on canvas. Los Angeles County Museum of Art.
A RAUCOUS ICE-BREAKER
Here is a novel way to create random pairs. Prepare slips of paper with matched pairs names of animals... Sheep, duck, cow, cat, chicken, cockerel, wolf, snake, parrot, goldfish,Tasmanian devil, etc.. When you give the signal students stand and make the animal noises to find each other. The technique is even more fun and chaotic if you need groups of three.
CLASS ACTIVITY i: LONDON UNDERGROUND
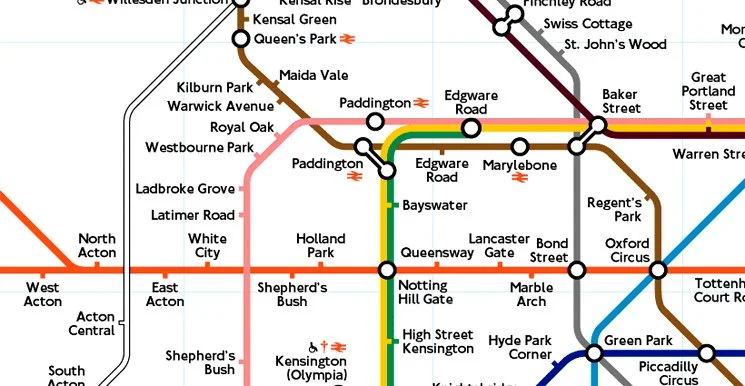
The London tube map was designed by Harry Beck in 1933. It is a simplified model of reality. The map informs the traveller how to navigate precisely between stations. It offers nothing more, nothing less, and ignores all extraneous information. The layout, which resembles a circuit diagram, corresponds only loosely to the physical locations of the stations.
Without revealing this spoiler paragraph to students, proceed straight to the hands-on activity without teacher comment...
Working in pairs, carefully circle all the visible London underground stations on your street map section (which accurately reflects satellite pictures of Central London).
Find the same stations on your section of the iconic London Underground Map.
Using a bold colored pen, connect the stations, respecting the way that they are actually connected underground.
Compare and contrast the orientations between stations and the distances apart on your two maps. What is going on here? How does the utility and accuracy of the London Underground map compare with the other subway or metro maps that you know?
Here is a printable pdf.
EXTENSION MATERIAL
Avoid revealing the extension material until the students have completed the tricky hands-on activity and have shared their perspectives.
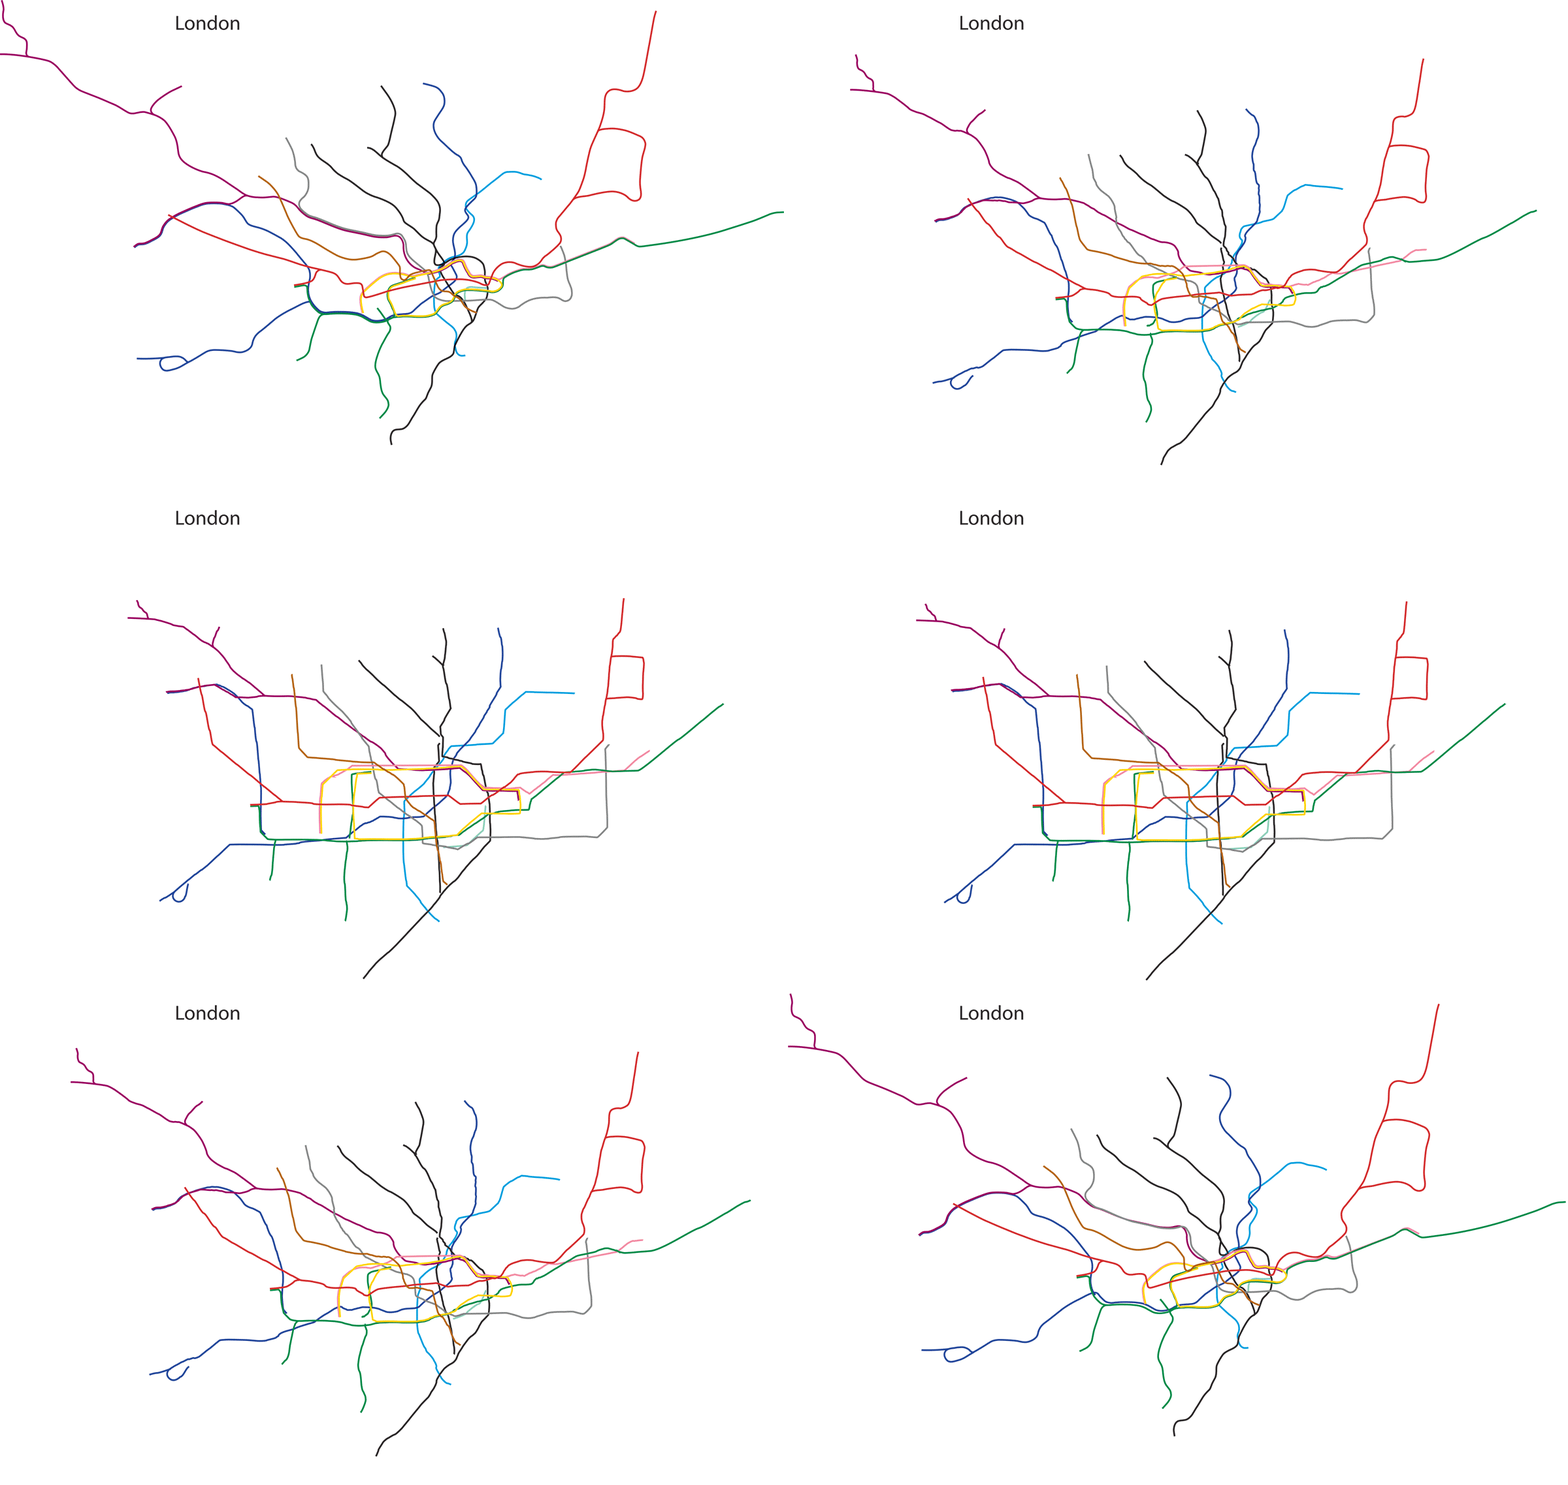
It is easy to adapt the class to the local environment. Many major cities around the world have spectacular subway systems with iconic simplified maps based on the conventions of the London original. Here is the San Francisco BART map compared to the Bay Area geographical map.
Here is the “geographically accurate” Central London Connections map that was only revealed to the general public after a 2014 Freedom of Information Act request.
Mayakovskaya, is a Metro station in central Moscow. The station opened in 1938 and is named after futurist poet, Vladimir Mayakovsky.
Photo: Ludvig14
CLASS ACTIVITY Ii: SIGNIFIERS
Image credit: Tony Hisgett;Wikimedia commons
1. Invite students to work online individually to research and write down the word for fish in as many European languages as possible in a timed 5 minutes.
2. Next work in pairs matched in the raucous icebreaker to find and write down as many words as possible, in any language, for the sounds that dogs make, in another timed 5 minutes.
3. Finally combine pairs to make groups of four. Students should appoint a spokesperson and scribe. They should address the following questions.
What is going on here? What patterns emerged? What are the essential differences between the various words for fish and the various words for dog sounds?
To what extent does the London underground class activity play into thinking about the findings of this language activity?
To what extent can we say that the words we use for things are mental maps?
Allow some reporting back and whole class discussion and then broaden the conversation by showing the following short Richard Feynman video. (Warn students in advance that Feynman affectionately caricatures three languages in a way that might be viewed as disrespectful today.)
Conclude with the quote from linguist Bill Lutz.
““Naming things is a human act, it is not an act of nature. We are the ones who through language create things out of the phenomena around us. Yet we forget that we control this process and let the process control us. Naming thing— using language—is a very high level abstraction, and when we name something we ‘freeze’ it by placing it in a category and making a ‘thing’ out of it. Language is a map but three important things to remember about maps are: the map is not the territory; no map can represent all aspects of the territory; and every map reflects the mapmaker’s point of view.””
To what extent can knowing the name of something help or hinder our understanding?
CLASS ACTIVITY III: MAP OF A CAT
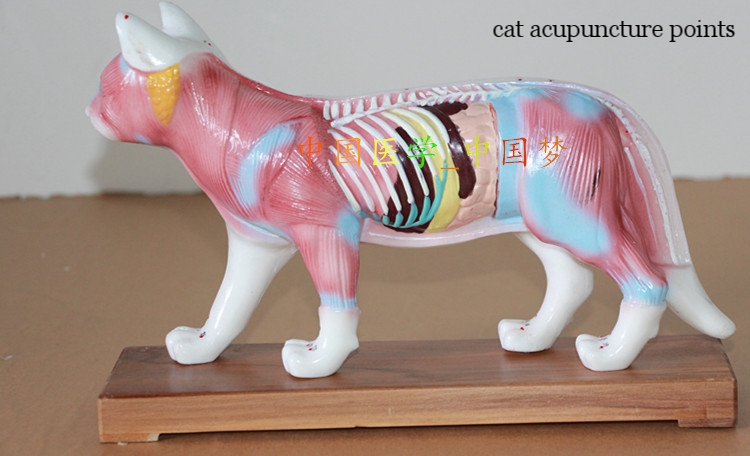
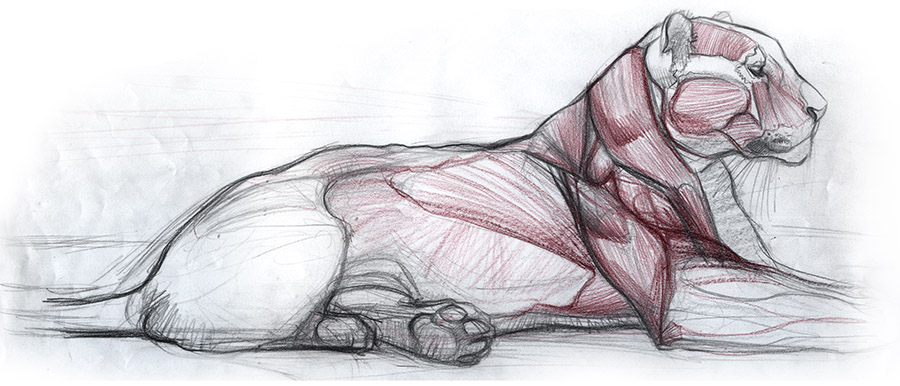
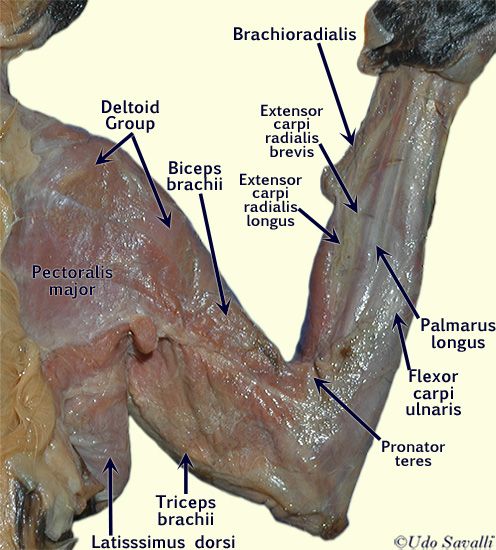
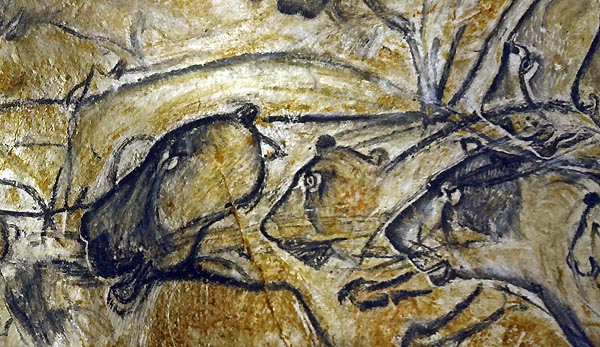
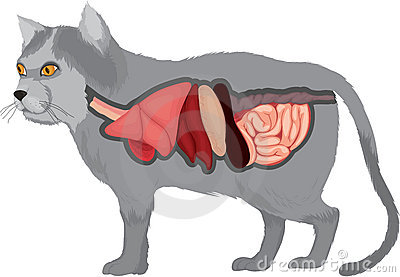
Invite the whole class to step forward and stand close to the screen in a darkened classroom. Scroll through this eccentric cat slideshow and invite comments. Taking each image in turn ask:
In this particular map of a cat, what is being emphasized?
What is being left out?
How effective or useful is the map?
CLASS ACTIVITY IV: SCIENTIFIC MODELS
With the whole class still at the front of the room, display this image. A version of it will be familiar to IB Biology students.
Singer-Nicholson Fluid Mosaic Model
Bioweb, University of Kentucky
Why is this called the Singer-Nicholson fluid mosaic model? Who were Singer and Nicholson?
What is fluid about the model?
Why is it a mosaic?
And for that matter what is a scientific model? Why not just call it a map?
Ask the biology students in the group to summarize in a few well chosen sentences current insights and understanding about the structure of the cell membrane revealed by the model.
Is the fluid mosaic model of cell membranes true?
Does a cell membrane really look like this? If not, why is a diagram just like this found in every advanced biology text book?
ZOOMING IN
Phospholipids are the basic units of the Singer-Nicholson model of the cell membrane.
Here are three different representations of three aspects of our current understanding of the phospholipid macromolecule. These images are each models in their own right.
What are the differences and commonalities here? Is one of these models better? If not, why not?
ZOOMING OUT AGAIN
Electron-micrograph of a cell membrane. This image is at the extreme upper limits of electron microscopy resolution. In terms of the accuracy/veracity of the image: keep in mind that preparations must be sliced, freeze-dried in a vacuum, and sprayed with gold, or other heavy metal, in order to deflect electrons that can be detected.
QUOTATIONS FOR REFLECTION
“Two important characteristics of maps should be noticed. A map is not the territory it represents, but, if correct, it has a similar structure to the territory, which accounts for its usefulness. If the map could be ideally correct, it would include, in a reduced scale, the map of the map; the map of the map of the map; and so on, endlessly...”
Borges with a real cat
“…In that Empire, the Art of Cartography attained such Perfection that the map of a single Province occupied the entirety of a City, and the map of the Empire, the entirety of a Province. In time, those Unconscionable Maps no longer satisfied, and the Cartographers Guilds struck a Map of the Empire whose size was that of the Empire, and which coincided point for point with it. The following Generations, who were not so fond of the Study of Cartography as their Forebears had been, saw that that vast Map was Useless, and not without some Pitilessness was it, that they delivered it up to the Inclemencies of Sun and Winters. In the Deserts of the West, still today, there are Tattered Ruins of that Map, inhabited by Animals and Beggars; in all the Land there is no other Relic of the Disciplines.
—Suarez Miranda, Viajes devarones prudentes, Libro IV, Cap.XLV, Lerida, 1658”


